To calculate risk of a stock, you can use measures such as beta, standard deviation, and the Sharpe ratio. These tools help assess the impact of market movements on a stock’s price and determine the level of risk associated with the investment.
By comparing these measures, you can evaluate the riskiness of different stocks and make informed investment decisions. Additionally, conducting a risk versus reward calculation can help determine whether a risk is worth taking. This involves dividing the estimated net profit from the decision by the maximum potential loss.
By understanding and calculating the risk of a stock, investors can better manage their portfolios and make strategic investment choices.
Introduction To Stock Risk
Understanding the risk associated with investing in stocks is crucial for making informed investment decisions. Stock risk refers to the potential for financial loss or underperformance that investors face when investing in a particular stock. By assessing and quantifying the risk, investors can make more informed decisions and develop strategies to mitigate potential losses.
The Importance Of Risk Assessment
Assessing the risk of a stock is vital for investors as it allows them to make informed decisions regarding their investment portfolios. By evaluating risk, investors can determine the potential for both positive and negative outcomes, enabling them to make strategic investment decisions.
Fundamentals Of Stock Risk
Stock risk is determined by various factors, including market volatility, company performance, and external economic conditions. Understanding the fundamentals of stock risk involves analyzing key metrics such as beta, standard deviation, and other risk measures to gauge the potential volatility and performance of a stock.
Key Risk Metrics For Stocks
When evaluating potential stock investments, it’s crucial to consider the associated risks. Understanding the key risk metrics for stocks can help investors make informed decisions and manage their portfolio effectively. Let’s explore the essential risk metrics that investors should analyze before investing in stocks.
Beta: Market Volatility’s Influence
Beta measures a stock’s volatility in relation to the overall market. A beta of 1 indicates that the stock’s price tends to move in line with the market. A beta greater than 1 signifies higher volatility, while a beta less than 1 indicates lower volatility compared to the market.
Alpha: Performance Against The Market
Alpha assesses a stock’s performance relative to the market. A positive alpha indicates that the stock outperformed the market, while a negative alpha suggests underperformance. It helps investors gauge a stock’s risk-adjusted return compared to the market.
Standard Deviation: Measure Of Volatility
Standard deviation quantifies the extent of a stock’s price fluctuations from its average price. A higher standard deviation indicates higher price volatility, signifying greater risk. Investors use standard deviation to assess the potential risk associated with a stock’s price movements.
Sharpe Ratio: Risk-adjusted Return
The Sharpe ratio evaluates a stock’s return in relation to its risk. It measures the excess return generated per unit of risk taken, providing insights into the risk-adjusted performance of a stock. A higher Sharpe ratio indicates better risk-adjusted returns.
R-squared: Correlation With Market Movements
R-squared measures the degree of correlation between a stock’s price movements and the movements of the overall market. It helps investors understand how much of a stock’s movement can be attributed to broader market trends, aiding in the assessment of systematic risk associated with the stock.
Volatility And Stock Performance
Understanding the volatility of a stock is crucial for assessing its risk and potential returns. Volatility measures the degree of variation in a stock’s trading price over time. A highly volatile stock may experience significant fluctuations, while a less volatile one may have more stable price movements. This section will delve into the concept of volatility and its impact on stock performance.
Understanding Volatility
Volatility refers to the degree of variation in a stock’s price over a specific period. It is a key indicator of risk and is often used to assess the stability of an investment. Stocks with higher volatility tend to carry more risk, while those with lower volatility are generally considered less risky. Investors closely monitor volatility to gauge the potential for both gains and losses in a stock’s value.
Historical Vs. Implied Volatility
Historical volatility is calculated based on past price movements, providing insight into a stock’s actual price fluctuations over a specific period. On the other hand, implied volatility reflects market expectations for a stock’s future price movements. This forward-looking measure is often derived from options pricing and can offer valuable insights into market sentiment and anticipated stock performance.
Calculating Beta And Its Implications
Calculating Beta is essential for determining the risk of a stock. It helps investors understand how a stock’s price is influenced by market movements. By calculating Beta, investors can make more informed decisions and compare the risk levels of different investments.
Finding Beta Values
Beta is a measure of a stock’s volatility in relation to the overall market. It helps investors to understand the risk associated with a particular stock. The beta value of a stock can be calculated by comparing the stock’s price movements with the movements of the market index over a period of time.
To find the beta value, you can use the following formula:
Beta = Covariance of the stock returns and market returns / Variance of the market returns
You can find the data for stock returns and market returns from various financial websites. Once you have the data, you can calculate the covariance and variance values using Excel or any other statistical software.
Interpreting Beta For Investment Decisions
A stock with a beta value of 1 means that its price movements are in line with the market movements. A beta value greater than 1 indicates that the stock is more volatile than the market, while a beta value less than 1 indicates that the stock is less volatile than the market.
Investors can use beta values to determine the risk associated with a particular stock. A high beta value indicates higher risk, while a low beta value indicates lower risk. However, it is important to note that beta values are historical measures and may not necessarily predict future price movements.
In addition, investors should consider other factors such as the company’s financial health, industry trends, and market conditions before making an investment decision.
In conclusion, calculating the beta value of a stock is an important step in assessing its risk. By understanding the implications of beta values, investors can make informed investment decisions.
Standard Deviation As A Risk Indicator
Standard Deviation is a useful indicator for calculating the risk of a stock. By measuring the variability of returns, it provides valuable insights into the potential ups and downs of an investment. Incorporating Standard Deviation into risk assessments helps investors make informed decisions and compare the risk levels of different stocks.
Calculating the risk of a stock is essential to make informed investment decisions. One of the most popular methods for measuring risk is using standard deviation. Standard deviation is a statistical tool that measures the amount of variability or dispersion around an average or mean value. In the context of stock investing, standard deviation measures the degree of fluctuation in a stock’s price compared to its average price over a specified period. The higher the standard deviation, the higher the risk.
Computing Standard Deviation
To calculate standard deviation, you need to follow these steps:
- Calculate the mean of the stock prices over a specific period.
- Calculate the difference between each stock price and the mean.
- Square the differences obtained in step 2.
- Calculate the average of the squared differences obtained in step 3.
- Take the square root of the average obtained in step 4.
Here is an example to help you understand better:
Suppose you want to calculate the standard deviation of a stock’s price over the last 30 days. You would follow these steps:
- Calculate the mean stock price over the last 30 days.
- Subtract the mean from each stock price to obtain the differences.
- Square each difference obtained in step 2.
- Calculate the average of the squared differences.
- Take the square root of the average.
Comparing Stocks With Standard Deviation
When comparing stocks, it’s important to look at their standard deviations. A stock with a higher standard deviation means it has a higher risk compared to a stock with a lower standard deviation.
However, you should not solely rely on standard deviation to make investment decisions. Other factors like the company’s financial health, industry trends, and overall market conditions should also be considered.
In conclusion, standard deviation is a useful tool to measure the risk of a stock. By calculating standard deviation, you can gain insights into the stock’s volatility and make informed investment decisions. Remember to use standard deviation in conjunction with other factors to get a complete picture of the stock’s risk profile.

Credit: www.ferventlearning.com
The Risk-reward Ratio
The risk-reward ratio is a crucial factor to consider when calculating the risk of a stock. By using tools such as beta and standard deviation, investors can assess the potential risk associated with a particular stock and make informed investment decisions.
Formulating The Risk-reward Calculation
When it comes to investing, there is always an inherent risk involved. However, as an investor, you can evaluate and compare the risks and rewards of different investment choices to make informed decisions. One way to do this is by using the risk-reward ratio, which involves calculating the potential risk of an investment against its potential reward.
To formulate the risk-reward calculation, you need to determine the potential reward of an investment by estimating the potential return on investment (ROI). This can be calculated by subtracting the initial investment from the final value of the investment and dividing it by the initial investment. The potential risk of an investment can be calculated by determining the potential loss if the investment does not perform as expected.
Applying The Ratio To Investment Choices
Once you have calculated the risk-reward ratio for different investment choices, you can use this information to evaluate and compare your options. An investment with a high risk-reward ratio may offer a potentially higher return, but also comes with a higher risk of loss. On the other hand, an investment with a lower risk-reward ratio may offer a more stable return, but with a lower potential for growth.
It is important to note that the risk-reward ratio is just one tool to evaluate investment choices and should not be the sole factor in making investment decisions. Other factors such as market trends, company performance, and personal financial goals should also be considered.
By utilizing the risk-reward ratio, investors can make informed decisions and manage their risk while seeking potential rewards. So, the next time you are considering an investment, take the time to calculate and evaluate its risk-reward ratio to make the best choice for your financial goals.
Value At Risk (var) Explained
Discovering the risk of a stock involves various measures such as alpha, beta, R-squared, standard deviation, and the Sharpe ratio. These tools can be used individually or in combination to evaluate risk. It is essential to compare similar investments to determine which carries the highest risk.
Var Methods And Formulas
Value at Risk (VaR) is a statistical measure that calculates the maximum amount of loss that an investment portfolio may suffer within a certain period of time with a given level of confidence. There are three main methods for calculating VaR:
- Historical Simulation
- Parametric VaR
- Monte Carlo Simulation
Historical Simulation
This method calculates VaR based on historical data. It assumes that the future returns of a stock will follow the same pattern as its past returns. Historical Simulation calculates VaR by ordering historical returns from worst to best and then selecting the return that corresponds to the desired level of confidence.
Parametric VaR
This method calculates VaR based on statistical properties of the investment portfolio, such as mean return and standard deviation. Parametric VaR assumes that the returns of the portfolio follow a normal distribution. This method is faster and more accurate than Historical Simulation, but it may not capture the extreme events that are not normally distributed.
Monte Carlo Simulation
This method calculates VaR by simulating thousands of possible outcomes for the investment portfolio. Monte Carlo Simulation uses statistical techniques to generate random scenarios for the future returns of the portfolio. This method captures the non-normal distribution of returns and can provide a more accurate estimate of VaR.
Practical Uses Of Var In Stock Analysis
VaR is a useful tool for investors to assess the risk associated with their investment portfolio. By calculating VaR, investors can determine the maximum potential loss they may suffer within a certain period of time with a given level of confidence. VaR can also be used to compare the risk of different investment portfolios and to optimize the portfolio’s risk-return tradeoff.
Investors can use VaR to set risk limits for their portfolios and to monitor the portfolio’s risk exposure over time. VaR can also be used to stress test the portfolio’s performance under extreme market conditions.
In conclusion, VaR is a powerful tool that can help investors to manage the risk of their investment portfolios. By using VaR, investors can make informed decisions about their investments and optimize their risk-return tradeoff.
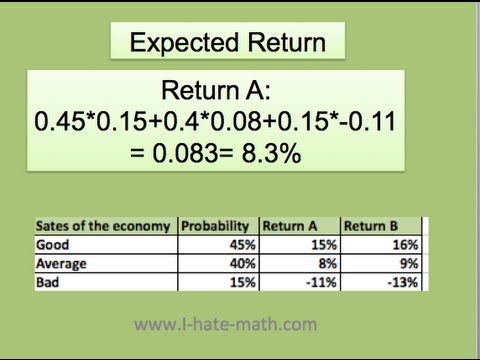
Credit: m.youtube.com
Diversification And Portfolio Risk
When it comes to investing in the stock market, understanding the concepts of diversification and portfolio risk is crucial. Diversification and portfolio risk management are essential components in building a successful investment strategy. Let’s delve into the benefits of diversification and how to calculate portfolio risk.
Benefits Of Diversification
Diversification is a key strategy that involves spreading your investments across various asset classes, industries, and geographic regions. This approach aims to reduce the overall risk of a portfolio by offsetting potential losses in one investment with gains in another. The benefits of diversification include:
- Minimization of risk associated with individual stocks
- Protection against market volatility
- Potential for improved risk-adjusted returns
- Enhanced stability and consistency in portfolio performance
Calculating Portfolio Risk
When it comes to assessing the risk of a portfolio, it’s essential to consider factors such as volatility, correlation among assets, and potential downside scenarios. The process of calculating portfolio risk involves evaluating the combined risk of all the assets within the portfolio, taking into account their individual characteristics and how they interact with one another.
One common method for measuring portfolio risk is through the calculation of standard deviation, which provides insight into the volatility of returns. Additionally, understanding the correlation between different assets in the portfolio is crucial for assessing the diversification benefits. By analyzing these factors, investors can gain a comprehensive understanding of the overall risk exposure of their investment portfolio.
Advanced Risk Assessment Tools
When it comes to advanced risk assessment in the world of stock investing, utilizing sophisticated tools is crucial for making informed decisions. These tools enable investors to gain a deeper understanding of the potential risks associated with their investment portfolios. In this article, we will explore two advanced risk assessment tools, namely Using Monte Carlo Simulations and Stress Testing Your Portfolio.
Using Monte Carlo Simulations
Monte Carlo simulations are a powerful tool for assessing the risk of a stock. This technique involves running multiple trial scenarios to analyze the potential outcomes of an investment based on various input variables. By simulating different market conditions and investment scenarios, investors can gain insights into the potential range of returns and identify the likelihood of various risk levels.
Stress Testing Your Portfolio
Stress testing is a crucial component of advanced risk assessment, allowing investors to evaluate how their portfolios would perform under adverse market conditions. By subjecting the portfolio to extreme scenarios such as market crashes or economic downturns, investors can assess the resilience of their investments and identify potential vulnerabilities. This proactive approach helps investors prepare for unexpected market events and make informed decisions to mitigate potential risks.
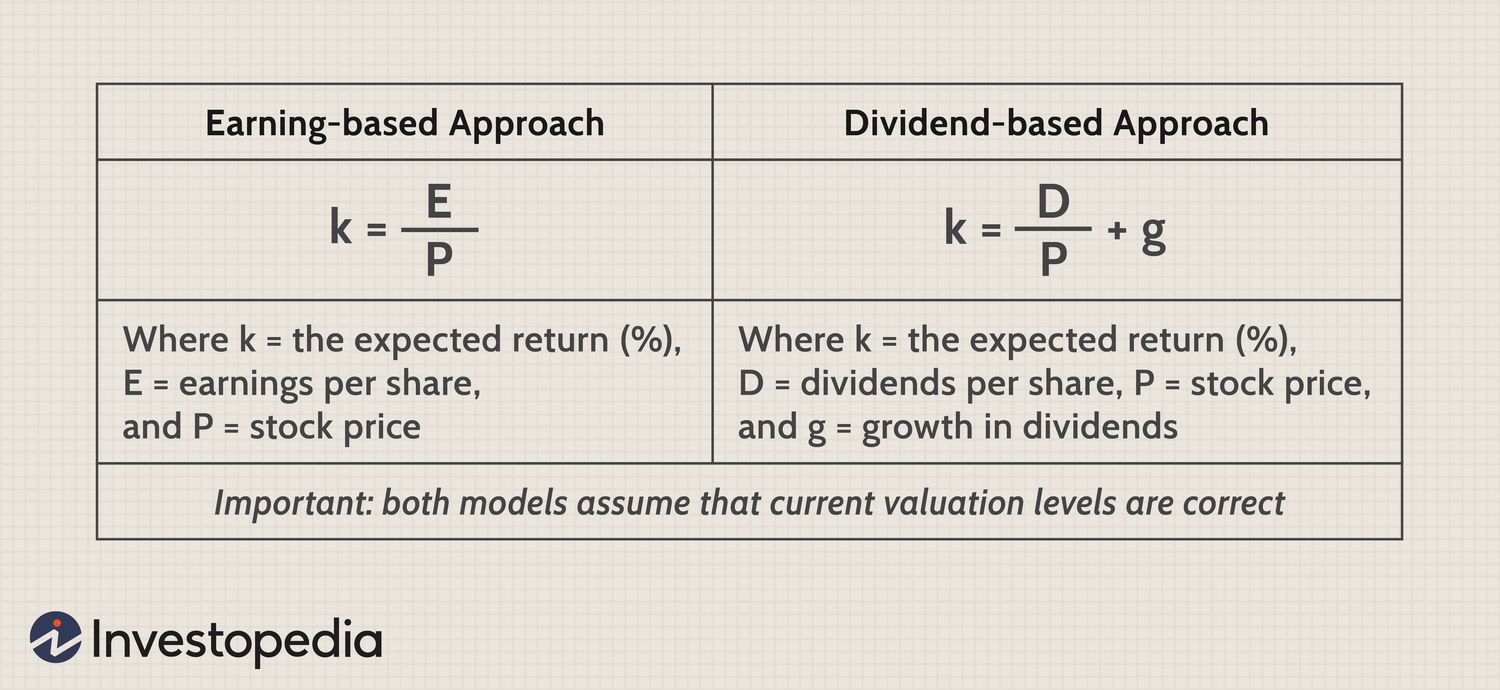
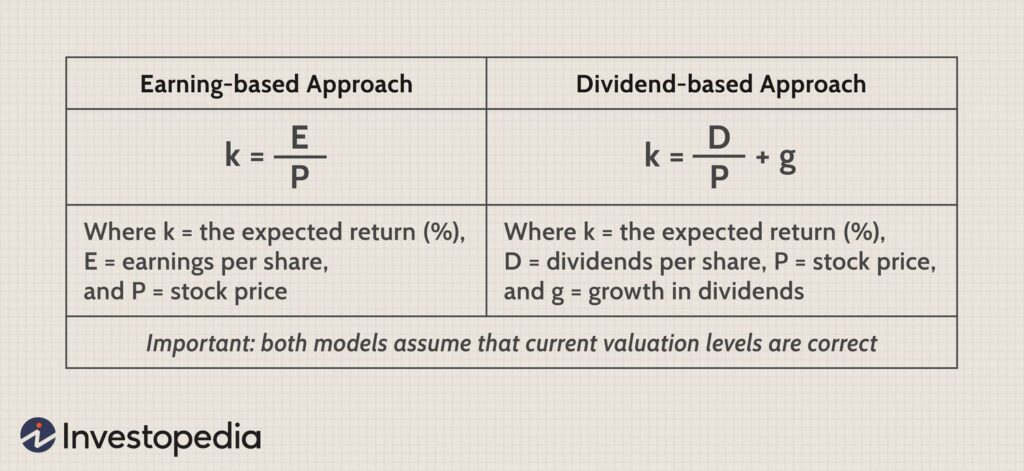
:max_bytes(150000):strip_icc()/dotdash_Final_Calculating_the_Equity_Risk_Premium_Dec_2020-06-acd73a07b27f4ea38d124481e271fe49.jpg)
Credit: www.investopedia.com
Making Informed Decisions
When it comes to investing in the stock market, it’s crucial to make informed decisions to mitigate risks and maximize returns. Understanding how to calculate the risk of a stock is essential for any investor looking to build a successful portfolio. By considering various risk measures and using the right tools, investors can make strategic decisions to achieve their financial goals.
Balancing Risk And Return
Balancing risk and return is key to making sound investment decisions. Investors should aim to achieve an optimal balance between the potential for high returns and the level of risk they are willing to take. By assessing the risk associated with a stock, investors can make informed choices that align with their risk tolerance and investment objectives. Understanding the relationship between risk and return is crucial for building a diversified and resilient investment portfolio.
Tools For The Smart Investor
Smart investors leverage various tools to evaluate the risk of a stock and make informed decisions. These tools include measures such as alpha, beta, standard deviation, and the Sharpe ratio. By utilizing these tools, investors can gain insights into the historical performance and risk profile of a stock, enabling them to assess its potential for returns and volatility. Additionally, investors can compare different stocks and investment opportunities to identify the most suitable options based on their risk-return preferences.
Frequently Asked Questions
How Do You Measure The Risk Of A Stock?
To measure the risk of a stock, you can use various measures including alpha, beta, R-squared, standard deviation, and the Sharpe ratio. These measures can be used individually or together to assess the risk of an investment. Comparing similar investments can help determine which one carries the highest risk.
Beta and standard deviation are commonly used tools to measure stock risk.
How To Find The Risk Of Stocks?
To find the risk of stocks, you can use tools like beta and standard deviation. Beta measures the historical impact of stock market movements on a stock’s price, while standard deviation measures the volatility of a stock’s returns. By comparing these measures, you can assess the risk of different stocks and make informed investment decisions.
What Is The Formula For Calculated Risk?
The formula for calculated risk involves dividing estimated net profit by maximum potential loss.
How Do You Calculate The Value At Risk Of A Stock?
To calculate the value at risk of a stock, use the formula VaR = Market Price * Volatility. This helps estimate potential losses within a certain confidence level.
Conclusion
To conclude, calculating the risk of a stock is crucial for making informed investment decisions. By using measures such as alpha, beta, R-squared, standard deviation, and the Sharpe ratio, investors can assess the level of risk associated with a particular stock.
It is important to compare similar investments to determine which holds the most risk. Additionally, conducting a risk versus reward calculation can help determine if a risk is worth taking. By carefully evaluating these factors, investors can better manage their portfolios and maximize potential returns.