The ultimate guide to technical analysis tools provides a comprehensive overview of the various tools used to analyze and predict price movements in the financial markets. From chart patterns to technical indicators, these tools enable traders and investors to make informed decisions based on historical data and mathematical calculations.
By gaining a solid understanding of these tools, traders can identify trends, support and resistance levels, and potential entry and exit points for their trades. Additionally, learning technical analysis can be achieved through backtesting or paper trading on electronic platforms offered by brokers and websites.
With the right knowledge and tools, traders can enhance their trading strategies and increase their chances of success in the market.

Credit: www.amazon.com
Introduction To Technical Analysis
Technical analysis is a method used by traders and investors to evaluate and forecast future price movements of financial assets by analyzing statistical trends gathered from trading activity, such as price movement and volume. It helps in identifying potential entry and exit points for trades and investments.
Why Technical Analysis Matters
Technical analysis matters because it provides valuable insights into market trends, helping traders and investors make informed decisions. By analyzing historical price data and chart patterns, technical analysis enables the identification of potential price movements and the timing of trades.
History And Evolution Of Technical Analysis
Technical analysis has a rich history dating back to the 17th century, originating from the Japanese rice trade. Over the years, it has evolved with the development of modern financial markets and advancements in technology. Today, it is an essential tool for traders and investors in analyzing and interpreting market trends.
The Basics Of Market Analysis
Market analysis is the foundation of successful trading. It involves evaluating the dynamics of a market to make informed decisions about buying and selling assets. Understanding the basics of market analysis is crucial for traders looking to navigate the complexities of the financial markets effectively.
Price Action: The Heart Of Technical Analysis
Price action is the cornerstone of technical analysis. It refers to the movement of a security’s price over time. By analyzing price action, traders can gain insights into market sentiment, identify trends, and anticipate potential price movements.
Volume And Market Sentiment
Volume and market sentiment play a pivotal role in technical analysis. Volume reflects the number of shares or contracts traded in a security, providing valuable information about the strength of a price movement. Market sentiment, on the other hand, captures the overall attitude of investors and traders toward a particular asset or market.
Popular Chart Types And Patterns
In the world of technical analysis, charts play a crucial role in helping traders identify trends and make informed decisions. Understanding popular chart types and patterns is essential for anyone looking to delve into the world of trading. In this guide, we will explore the three popular chart types – Line, Bar, and Candlestick Charts, as well as delve into the significance of chart patterns in technical analysis.
Line Charts
Line charts are one of the simplest and most commonly used chart types in technical analysis. They display the closing prices of a security over a set period, connecting each data point with a line. Line charts provide a clear visual representation of price trends over time, making them ideal for identifying long-term patterns.
Bar Charts
Bar charts are another popular chart type used by traders to analyze price movements. They display the open, high, low, and close prices for a given period, providing a comprehensive view of price action. Bar charts are valuable for identifying price volatility and potential reversal patterns.
Candlestick Charts
Candlestick charts are renowned for their ability to convey a wealth of information in a single visual. Each candlestick represents the open, high, low, and close prices for a specific period. Candlestick patterns are widely used to identify market sentiment and forecast potential price movements.
Understanding Chart Patterns
Chart patterns are an integral part of technical analysis, offering valuable insights into potential future price movements. By recognizing and interpreting these patterns, traders can anticipate trend reversals, continuations, and other significant market developments.
Key Technical Indicators Explained
Discover the ultimate guide to technical analysis tools and learn how to effectively use key technical indicators. Gain a solid understanding of chart patterns and technical indicators, such as Stochastic Oscillator and Bollinger Bands, to predict future price movements. Enhance your trading skills and make informed investment decisions with the help of these powerful tools.
Key Technical Indicators Explained Technical analysis is an essential tool for traders to analyze the market trends and make informed decisions. Technical analysis tools help traders to identify patterns, trends, and potential entry and exit points. In this guide, we will explain some of the key technical indicators used in technical analysis. Moving Averages Moving averages are one of the most commonly used technical indicators. They are used to smooth out the price action and identify the trend direction. Moving averages are calculated by averaging the price of an asset over a specific period, such as 20, 50, or 200 days. Traders use moving averages to identify support and resistance levels and potential entry and exit points. Momentum Indicators: RSI and Stochastic Oscillator Momentum indicators are used to measure the strength and speed of a trend. Two popular momentum indicators are the Relative Strength Index (RSI) and the Stochastic Oscillator. The RSI measures the strength of an asset’s price action by comparing the average gains to the average losses over a specific period. The Stochastic Oscillator compares the closing price of an asset to its price range over a specific period. Traders use these indicators to identify overbought and oversold conditions, potential trend reversals, and potential entry and exit points. In conclusion, technical analysis tools are essential for traders to analyze market trends and make informed decisions. Moving averages and momentum indicators such as RSI and Stochastic Oscillator are crucial technical indicators that traders use to identify potential entry and exit points.Advanced Tools For Market Analysis
Discover advanced tools for market analysis in this comprehensive guide to technical analysis tools. From stochastic oscillators to Bollinger Bands and Fibonacci retracement, learn about the primary tools used in technical analysis to predict future price movements and make informed trading decisions.
Advanced Tools for Market Analysis Technical analysis is an important aspect of trading that helps traders identify potential trading opportunities based on market trends and patterns. While there are many technical analysis tools available, advanced tools for market analysis are especially useful for experienced traders who want to take their trading strategies to the next level. In this article, we will explore three advanced technical analysis tools that can help traders make informed trading decisions: Fibonacci retracement levels, Bollinger Bands, and volatility.Fibonacci Retracement Levels
Fibonacci retracement levels are a popular technical analysis tool used to identify potential support and resistance levels in a market. These levels are based on the Fibonacci sequence of numbers, which is a series of numbers where each number is the sum of the two preceding numbers. Traders use Fibonacci retracement levels to identify potential areas of price reversal or continuation.Bollinger Bands And Volatility
Bollinger Bands are a technical analysis tool that uses a moving average and standard deviation to identify potential price reversal or continuation. Traders use Bollinger Bands to identify potential entry and exit points in a market based on the volatility of the market. The bands expand and contract based on the volatility of the market, making them a useful tool for traders who want to take advantage of market volatility. Volatility is a measure of the amount of price movement in a market. High volatility means that prices are fluctuating rapidly, while low volatility means that prices are relatively stable. Traders use volatility as an indicator of market sentiment and to identify potential trading opportunities. By combining Bollinger Bands and volatility, traders can identify potential entry and exit points in a market based on the level of volatility. In conclusion, advanced technical analysis tools such as Fibonacci retracement levels, Bollinger Bands, and volatility can help traders make informed trading decisions based on market trends and patterns. While these tools require a certain level of experience and expertise, they can be invaluable for traders who want to take their trading strategies to the next level.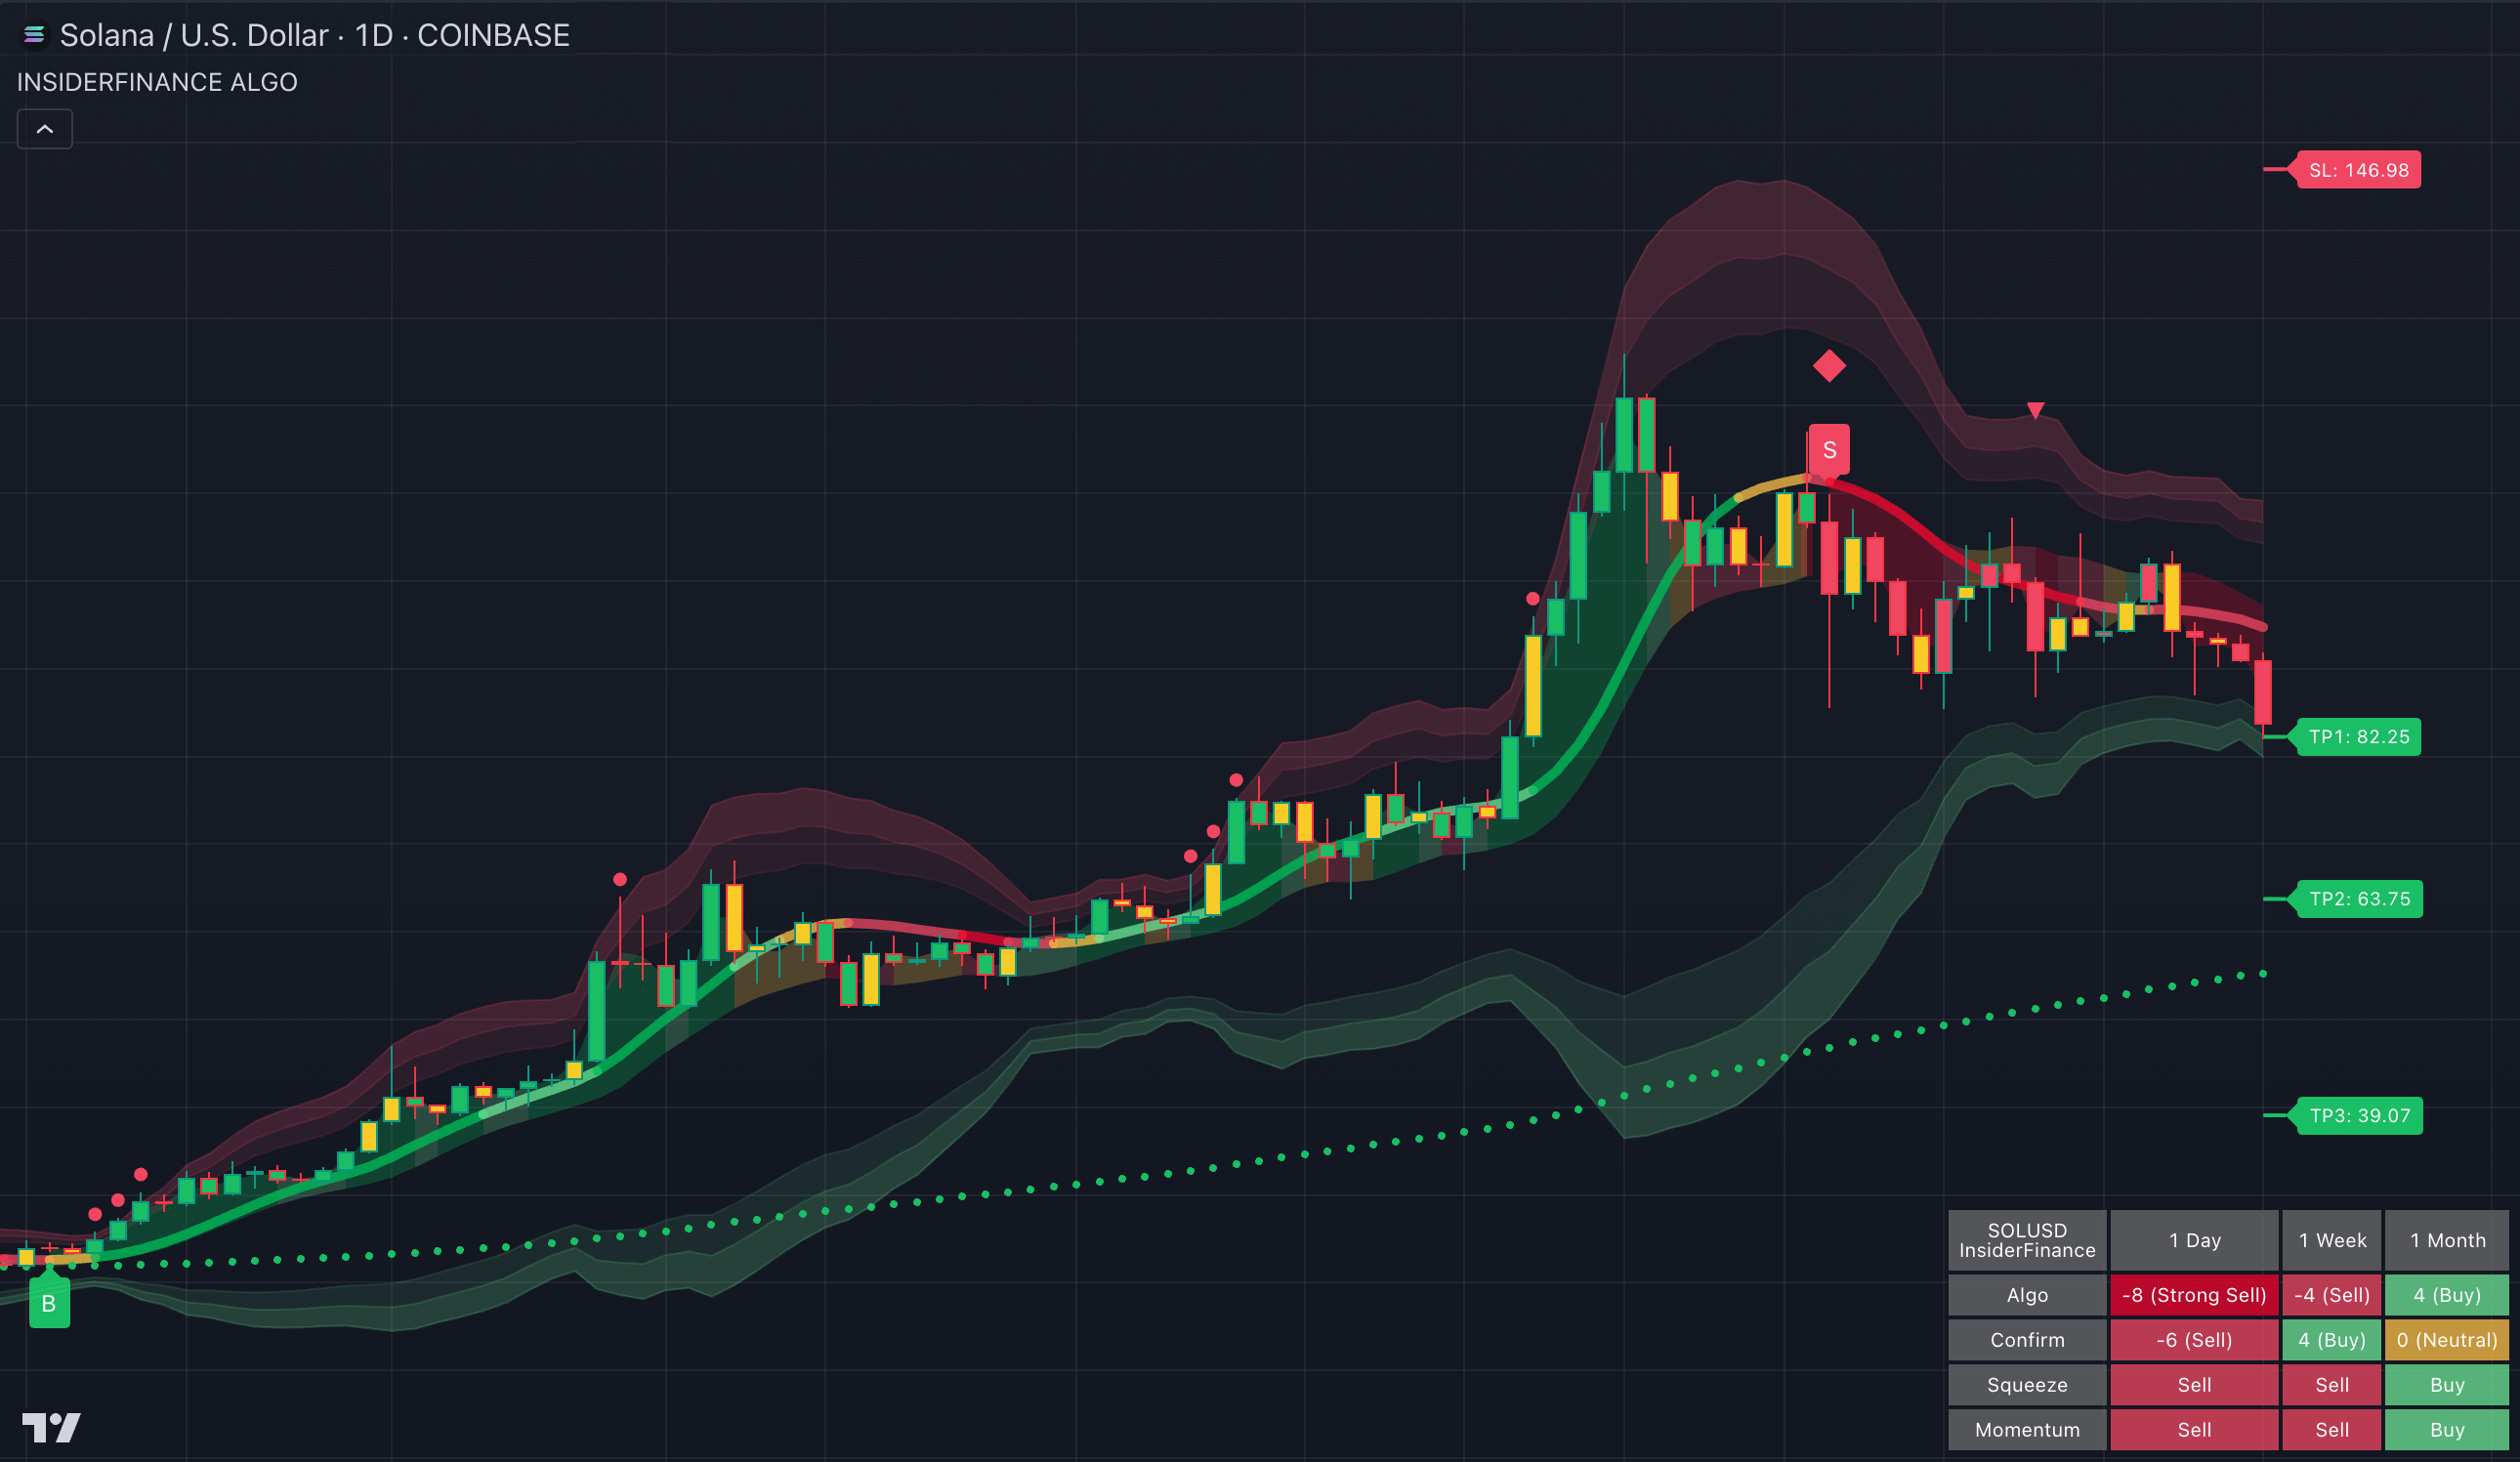
Credit: www.insiderfinance.io
Constructing A Technical Analysis Toolkit
Constructing a Technical Analysis Toolkit is a comprehensive guide that provides valuable insights into the different tools used in technical analysis. From stochastic oscillators to Bollinger Bands, this guide covers the primary tools and explains how to effectively use them for analyzing charts and making informed trading decisions.
Whether you’re a beginner or an experienced trader, this resource will help you enhance your technical analysis skills and achieve success in the financial markets.
Constructing a Technical Analysis Toolkit As a trader, constructing a technical analysis toolkit is crucial to enhancing your analysis. Technical analysis tools are used to identify market trends, price movements, and potential trading opportunities. With the right set of tools, traders can make informed decisions and improve their chances of success in the market. Selecting the Right Tools for Your Strategy Selecting the right tools for your strategy is the first step in constructing your technical analysis toolkit. There are several types of tools available, including charts, indicators, and oscillators. It’s essential to understand the strengths and weaknesses of each tool and select the ones that align with your strategy. For example, if you’re a trend trader, you may want to focus on tools that help identify and confirm trends, such as moving averages and trendlines. Combining Tools for Enhanced Analysis Combining tools is another way to enhance your analysis. By using multiple tools, you can confirm signals and get a more comprehensive view of the market. For example, you can use a moving average crossover strategy in combination with a stochastic oscillator to confirm buy or sell signals. However, it’s essential to avoid overcomplicating your analysis by using too many tools. Some of the best technical analysis tools include: – Stochastic Oscillator – ADX (Average Directional Index) – Bollinger Bands – RSI (Relative Strength Index) – Fibonacci Retracement – Parabolic SAR – Supertrend – CCI (Commodity Channel Index) In conclusion, constructing a technical analysis toolkit is crucial to improving your trading performance. By selecting the right tools for your strategy and combining them for enhanced analysis, you can make informed decisions and improve your chances of success in the market.Applying Technical Analysis In Different Markets
Applying technical analysis tools in different markets is a comprehensive guide that provides insights into how to effectively use technical analysis for trading. Discover the best tools, such as stochastic oscillators, Bollinger Bands, and Fibonacci retracement, to analyze charts and indicators for making informed trading decisions.
Learn the core principles and practice through backtesting or paper trading on electronic platforms to gain a solid understanding of technical analysis.
Applying Technical Analysis in Different Markets Technical analysis is a powerful tool that can be applied to different markets, including stocks and equities, forex, and commodities. Each market has its own unique characteristics, but technical analysis can be used to identify trends and patterns that can inform trading decisions. In this guide, we will explore how technical analysis can be applied to each of these markets.Stocks And Equities
Stocks and equities are popular trading instruments that are traded on stock exchanges around the world. Technical analysis can be used to identify trends and patterns in stock prices, volume, and other indicators. Some popular technical indicators used in stock trading include moving averages, relative strength index (RSI), and MACD. Chart patterns such as head and shoulders, double tops, and triple bottoms can also be used to identify potential trading opportunities.Forex And Commodities
Forex and commodities markets are global markets that are heavily influenced by economic and geopolitical events. Technical analysis can be used to identify trends and patterns in currency and commodity prices, which can inform trading decisions. Some popular technical indicators used in forex and commodity trading include Fibonacci retracements, Bollinger bands, and stochastic oscillators. Chart patterns such as triangles, flags, and pennants can also be used to identify potential trading opportunities. In conclusion, technical analysis is a powerful tool that can be applied to different markets, including stocks and equities, forex, and commodities. By using technical analysis, traders can identify trends and patterns that can inform their trading decisions. Whether you are a beginner or an experienced trader, technical analysis can help you become a more successful trader.
Credit: fastercapital.com
Developing A Trading Plan Using Technical Analysis
Technical analysis is an essential tool for traders to make informed decisions and maximize their profits. Developing a trading plan using technical analysis involves setting up trade criteria, implementing risk management strategies, and establishing exit plans to ensure a structured approach to trading.
Setting Up Trade Criteria
Setting up trade criteria involves identifying specific conditions that must be met before executing a trade. These criteria may include identifying key technical indicators, such as moving averages, confirming trend patterns, and analyzing volume trends to validate potential trade opportunities.
Risk Management And Exit Strategies
Implementing effective risk management strategies is crucial in minimizing potential losses. Traders can utilize stop-loss orders to limit their downside risk and protect their capital. Additionally, establishing clear exit strategies based on predefined profit targets and risk-reward ratios can help traders make disciplined decisions.
Practical Tips And Resources
When delving into the world of technical analysis, it’s essential to equip yourself with practical tips and resources that can aid in your learning journey. Continuous learning and practice, along with utilizing recommended software and platforms, are pivotal for honing your skills in technical analysis.
Continuous Learning And Practice
Continuous learning is the cornerstone of mastering technical analysis. Engage in consistent practice to reinforce your understanding and sharpen your analytical abilities. Embrace the vast array of educational materials available, from online courses and tutorials to insightful books authored by renowned experts in the field.
Recommended Software And Platforms
Access to reliable software and platforms can significantly enhance your technical analysis endeavors. Consider utilizing tools such as Stochastic Oscillator, ADX (Average Directional Index), Bollinger Bands, RSI (Relative Strength Index), Fibonacci Retracement, Parabolic SAR, Supertrend, and CCI (Commodity Channel Index) to empower your analysis with accurate insights.
Common Pitfalls And How To Avoid Them
When using technical analysis tools, it’s important to be aware of common pitfalls that can lead to inaccurate interpretations and poor trading decisions. By understanding these pitfalls and knowing how to avoid them, traders can enhance the effectiveness of their technical analysis strategies and improve their overall trading performance.
Overreliance On Indicators
One common pitfall in technical analysis is the overreliance on indicators. Relying solely on indicators without considering other aspects of the market can lead to misleading signals and false trading opportunities. Traders should avoid using an excessive number of indicators and instead focus on a few key ones that align with their trading strategy and complement each other.
Ignoring Market Context
Another common pitfall is ignoring the broader market context when analyzing individual securities. Failing to consider market trends, economic indicators, and geopolitical events can result in a narrow and incomplete analysis, leading to suboptimal trading decisions. Traders should always take into account the overall market environment and how it may impact the securities they are analyzing.
The Future Of Technical Analysis
Discover the future of technical analysis with our comprehensive guide to technical analysis tools. Gain insights into the best tools for analyzing price patterns, indicators, and more, to predict future price movements and make informed investment decisions. Enhance your trading strategies with the power of technical analysis.
Incorporating Machine Learning
Incorporating machine learning into technical analysis is the future of trading. By utilizing powerful algorithms and data analysis, machine learning can identify patterns and trends in the market that may not be easily detected by human traders. This advanced technology can analyze vast amounts of historical data and make predictions about future price movements with a high level of accuracy. With machine learning, traders can gain a competitive edge and make more informed decisions based on data-driven insights.Adapting To Market Changes
In the ever-changing financial markets, it is crucial for technical analysis tools to adapt and evolve. Traders need tools that can quickly adjust to market conditions and provide real-time analysis. Whether it’s incorporating new indicators, developing advanced charting techniques, or integrating artificial intelligence, the future of technical analysis lies in its ability to adapt to market changes. By staying ahead of the curve and embracing innovation, traders can effectively navigate volatile markets and capitalize on emerging opportunities.Ensuring Accuracy And Reliability
When it comes to technical analysis, accuracy and reliability are paramount. Traders rely on tools that provide accurate data and generate reliable signals to make informed trading decisions. The future of technical analysis tools lies in their ability to enhance accuracy through advanced algorithms and data processing techniques. By continuously improving the quality and reliability of their analysis, these tools can provide traders with a competitive edge and increase their chances of success in the market. As the financial markets continue to evolve, technical analysis tools must adapt and embrace new technologies to stay relevant. Incorporating machine learning and adapting to market changes are key factors in shaping the future of technical analysis. By ensuring accuracy and reliability, these tools can empower traders with valuable insights and help them make more informed trading decisions. Embracing these advancements will be crucial for traders looking to stay ahead in the dynamic world of financial markets.Frequently Asked Questions
How Can I Teach Myself Technical Analysis?
To teach yourself technical analysis, start by understanding core principles and practicing through backtesting or paper trading. Utilize electronic platforms offered by brokers for simulated trading. Explore resources such as Investopedia and books on technical analysis tools. Experiment with tools like Stochastic Oscillator, Bollinger Bands, and RSI for analysis.
What Is The Best Tool For Technical Analysis?
The best tool for technical analysis is the Stochastic Oscillator, ADX, Bollinger Bands, RSI, Fibonacci Retracement, Parabolic SAR, Uptrend, and CCI. These tools help analyze price movements and identify potential trade opportunities.
What Are The Primary Tools Of Technical Analysis?
The primary tools of technical analysis are charts and indicators. Charts display price and volume data, while indicators help analyze the charts.
What Are The Two Major Types Of Tools Used In Technical Analysis?
The two major types of tools used in technical analysis are chart patterns and technical indicators. Chart patterns involve studying historical price patterns, while technical indicators use mathematical calculations on price and volume data. These tools help traders predict the probable future price movement of a security based on market trends.
Conclusion
To conclude, understanding technical analysis tools is crucial for successful trading. By gaining a solid understanding of core principles and utilizing electronic platforms for backtesting or paper trading, one can learn technical analysis effectively. The best tools for technical analysis include the Stochastic Oscillator, ADX, Bollinger Bands, RSI, Fibonacci Retracement, Parabolic SAR, Supertrend, and CCI.
Additionally, chart patterns and technical indicators are the primary tools used in technical analysis. By utilizing these tools effectively, traders can make informed decisions and identify potential investments. Start mastering technical analysis and enhance your trading strategies today.